Monitor your solar panels through the manufacturer’s smartphone app or web portal connected to the inverter. These platforms show real-time energy production, panel-level performance, and system health. Most systems send automated alerts for outages. Third-party monitors, such as Sense, track detailed home energy usage independently.
What Is Solar Panel Monitoring and Why Does It Matter?
Understanding Solar Monitoring Systems
A solar monitoring system tracks and analyzes your PV system’s performance, providing information about energy consumption and generation. Essentially, these systems collect data from solar panels, inverters, and other components to deliver real-time insights about energy production, system performance, and potential issues. Most solar companies will set you up with a monitoring system connected to the inverter through proprietary software. Currently, most systems operate through apps available on your devices and can use cellular data on mobile phones or tablets, ensuring your data remains accessible even if Wi-Fi connection is lost.
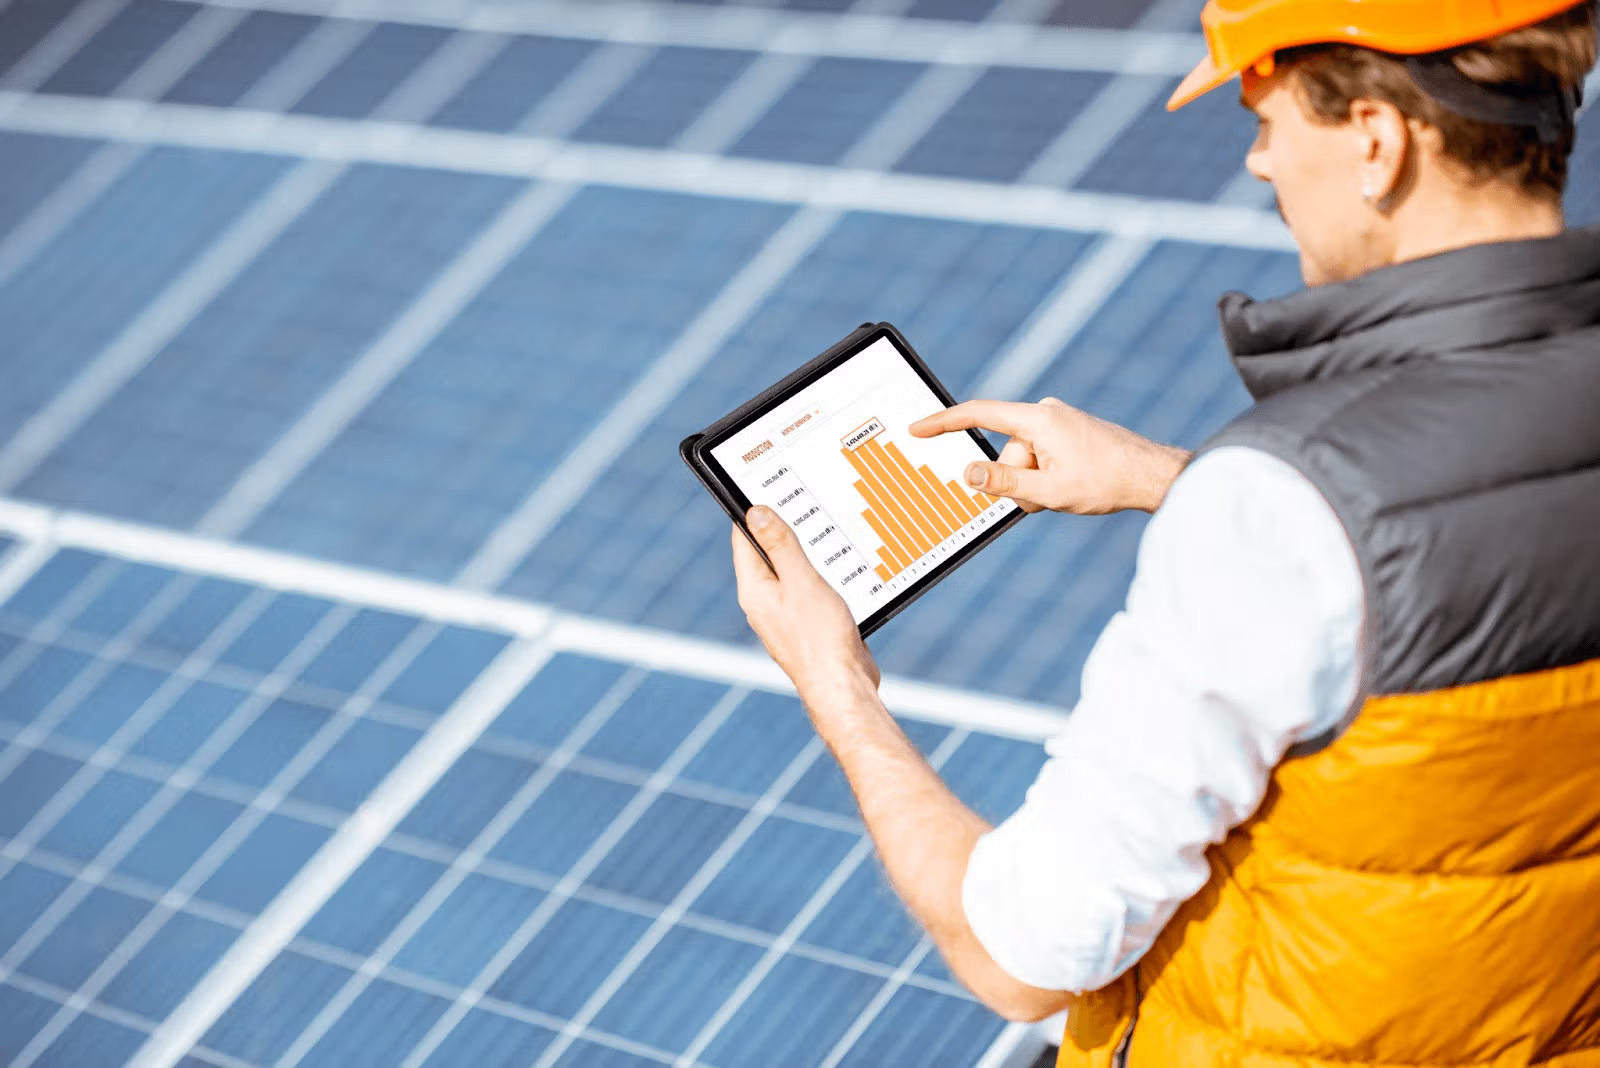
The monitoring platform processes data from your inverter and presents it in an easy-to-understand format, often with charts, graphs, and reports that provide insights into your system’s performance. This technological solution serves as the central hub for tracking how much electricity your panels generate, how much energy your household uses, and how much power gets sent back to the grid or stored in batteries.
Signs Your Solar Panels May Need Attention
Without monitoring, figuring out if your solar panels are operating at their best becomes difficult. One of the first indications that something is wrong with your panel’s production is an unusually high energy bill. Utility bills can be months out of date, so you don’t want to wait for a large unexpected bill before realizing something is wrong.
Other warning signs include drastic drops in energy production compared to previous performance, particularly when weather conditions remain similar. Inverter warning lights provide immediate alerts—green lights typically indicate proper function, while yellow or red lights signal issues. Inconsistent monitoring data, including gaps in performance data or unusual spikes and drops in production, could point to inverter communication problems or system-wide issues. Additionally, loose or damaged wiring, shade affecting panels (especially problematic with string inverters), and dirt or debris blocking sunlight all impact performance.
Benefits of Regular Solar Panel Monitoring
Regular monitoring helps extend the life of your system and saves you money. By keeping a close eye on your solar panels, they can last for decades with very little maintenance. Monitoring helps you identify any potential issues quickly, keeping your solar panel system healthy. Early detection of problems prevents minor issues from becoming major failures, reducing downtime and maintenance costs. Continuous monitoring of system health helps in early detection of potential problems, reducing the risk of significant failures, consequently protecting your investment and maximizing your return.
How to Check If Your Solar Panels Are Working
Using Your Inverter Display
Your inverter provides the most direct way to monitor solar panel output. LED indicators offer instant visual feedback about operational status. A solid green light means your system is producing power, while a blue light indicates connectivity to the monitoring platform. Red lights signal system errors requiring immediate attention.
For numerical data, tap or press buttons on your inverter’s LCD screen. SolarEdge inverters display total energy production under “Total [KWh]”. SMA Sunny Boy models show this as “E-Total”, while Fronius inverters list it under the “Total” menu option. These readings represent cumulative energy generated since installation.
Checking Your Solar Meter
Smart meters installed with solar systems record both import and export activity. Press the display button to cycle through screens showing different metrics. The import reading shows electricity drawn from the grid, while export readings display surplus energy sent back. Bidirectional meters feature moving dots on the LCD display, flowing right when receiving grid power and left when delivering solar energy to the grid. Look for labels like “DEL” for delivered energy, “REC” for received energy, and “NET” for the difference between the two.
Monitoring Apps from Equipment Manufacturers
Enphase Enlighten offers panel-level tracking through its Array tab, showing individual panel performance. The Status tab delivers real-time snapshots, while the Energy tab provides historical graphs by day, week, or month. Correspondingly, mySolarEdge includes WeatherGuard, providing location-based weather insights to help anticipate production fluctuations. The Tesla app shows energy distribution between home consumption, battery storage, and grid export.
Third-Party Solar Monitoring Systems
Companies like Sense, Curb, and Emporia provide monitoring solutions independent of equipment manufacturers. These systems attach sensors to your electrical panel and track overall electricity use. Third-party platforms can complement manufacturer apps, though compatibility varies between systems.
Understanding Your Solar Panel Output Data
Reading Production Metrics (kWh)
Kilowatt-hours represent the fundamental measurement for tracking solar energy production. This metric shows cumulative electricity generated over time, measured by your inverter or monitoring system. About 97% of home solar panels quoted in the second half of 2025 produce between 400 and 460 watts. For example, a 430-watt panel in California will produce about 645 kWh in a year, or roughly 1.77 kWh daily. Your monitoring display shows both instantaneous power production in kilowatts and cumulative energy generated in kWh.
Tracking Daily and Seasonal Performance
Production follows predictable patterns throughout each day. Output starts low at sunrise, peaks around solar noon, then tapers toward sunset. Seasonal variations are equally normal. Summer production can exceed winter output by 30-40% due to longer days and higher sun angles. Solar production is significantly reduced during winter, by as much as 80% compared to summer months. This happens because of shorter day length, increased cloud cover, and lower sun angle. Spring sees rising production as days lengthen.
Identifying Performance Issues
Watch for unexplained drops exceeding 15% compared to previous weeks under similar conditions. Flat lines during sunny hours often signal inverter shutdown or grid disconnection. Sharp drops during peak hours may indicate shading, dirty panels, or partial string faults. Solar panels degrade at a rate of about 0.5% per year, so gradual declines are normal.
Comparing Expected vs Actual Output
If you live in a sunny state like California, your panel’s production ratio is probably around 1.5, meaning a 10 kilowatt system produces 15,000 kWh annually. Compare daily production on similar weather days. If output drops without weather changes, investigate immediately. Energy production from year to year can vary by as much as 20%, though it generally remains fairly consistent.
Making the Most of Your Solar Monitoring System
Best Times to Use Electricity with Solar Panels
Peak solar production occurs between 10 AM and 3 PM, making this window ideal for running energy-intensive appliances. Schedule dishwashers, washing machines, and dryers during these hours to consume energy directly from your panels rather than the grid. Electric vehicle charging during peak solar hours can increase self-consumption by 20-40% for EV owners. Hot water heating programmed for midday operation delivers potential self-consumption increases of 15-25%. Pool pumps running during solar peak hours add another 10-15% increase for pool owners.
Time-of-use rates charge different prices throughout the day. Peak electricity rates typically hit during late afternoon and evening hours when solar production declines. Battery storage captures midday surplus for use during expensive peak hours, allowing you to avoid purchasing grid power at premium prices.
Tracking Energy Consumption Patterns
Home energy monitors track power usage in real-time, showing which appliances consume the most electricity. These devices connect to your electrical panel and measure electricity flow, delivering detailed insights into consumption patterns. Monitoring solar production alongside consumption reveals when you’re generating more than you’re using versus drawing from the grid. This visibility helps align high-energy tasks with peak solar generation periods. Households using real-time feedback typically reduce electricity consumption by 2-9%.
Optimizing Self-Consumption
Solar self-consumption means using generated electricity for your own needs instead of sending it back to the grid. Load-shifting involves adjusting energy usage to match peak solar production times. Running appliances during sunny hours minimizes waste and improves returns on your solar investment. Smart plugs and timers automate appliance operation during solar abundance. Water heaters account for about 18% of household energy consumption. Scheduling water heating during peak solar hours can slash heating bills by 50% to 80%.
Home energy management systems provide real-time insights into production and consumption. These tools reveal usage trends and empower adjustments for optimal solar utilization. Without energy management systems, households struggle to use more than 50% of solar production. The remaining energy gets sold to utilities at cheap prices, extending payback time on your initial investment.
When to Contact Your Solar Installer
Contact your installer when monitoring data shows persistent production drops exceeding 15% without weather-related causes. Inverter error lights, unusual system alerts, or complete production stops during sunny conditions require professional diagnosis. Proper maintenance can increase energy production by around 15%. Regular inspections ensure optimal operation and long-term economic benefits.
Schedule professional cleaning if dirt accumulation blocks sunlight, as debris decreases efficiency and could cause permanent damage if left unaddressed. Physical damage to panels, loose wiring, or communication failures between system components also warrant immediate installer contact.
Conclusion
You now have everything you need to monitor your solar panels effectively and ensure they’re performing at their best. Regular monitoring protects your investment and helps you catch problems before they drain your savings. For the most part, modern monitoring tools make tracking performance simple and accessible right from your phone.
Start checking your system today, optimize your energy usage during peak solar hours, and watch your electricity bills drop while your savings grow.